Contents
- 1
- 2
- 3 Forex trading using price action | Momentum tactic
- 3.1 Forex trading using price action | Momentum tactic
- 3.1.1 Forex trading ranges are surprisingly predictable.
- 3.1.2 Strength and follow-ups on trend day
- 3.1.3 Trade Forex when there is a strong uptrend
- 3.1.4 Any dip in the green bar is considered minor and short-lived.
- 3.1.5 Old School High and Low Low in Forex
- 3.1.6 Watch the price movement of Forex currencies closely.
- 3.2 Summary
- 3.1 Forex trading using price action | Momentum tactic
Forex trading using price action | Momentum tactic
If you’re looking for the most effective price action trading strategies, I want your full attention because I’m about to reveal my top tactics after over ten years of price action trading. We will not discuss support or resistance, Japanese candlestick patterns, or chart patterns. I will share something more important: how to read price action momentum and decode market rhythm.
Forex trading using price action | Momentum tactic
Here is your first lesson on how you recognize what type of day trading you are in. You can apply the appropriate trading techniques when you realize what kind of day you are dealing with. If it is a trend, pullbacks are the best option. It does not matter whether this is the first or second withdrawal, Single bar pullback, or complex pullback. If the trading day is in a range, you only enter the extremes of the range, wait for an explicit confirmation, and stay away from the middle because it can be very choppy.
I use price action to read the market and evaluate price momentum. The main reason I prefer price action rather than using indicators is that the indicators will lose their power when the market is not trending. They create all kinds of false signals on range days. This is a big problem because the market is sideways more than 70% of the time, one thing I’ve discovered over many years of trading.
Forex trading ranges are surprisingly predictable.
The market is in a “fair price” zone, where buyers and sellers are somewhat “passive.” Here are several strategies to help you know what kind of day awaits you. First, we will talk about price action during popular days.
Strength and follow-ups on trend day
Whether an uptrend or a downtrend, the bar that starts the trend usually has good follow-ups. The market has a rhythm, like music. You can feel the urgency in the rhythm and the power behind each bar as it forms.
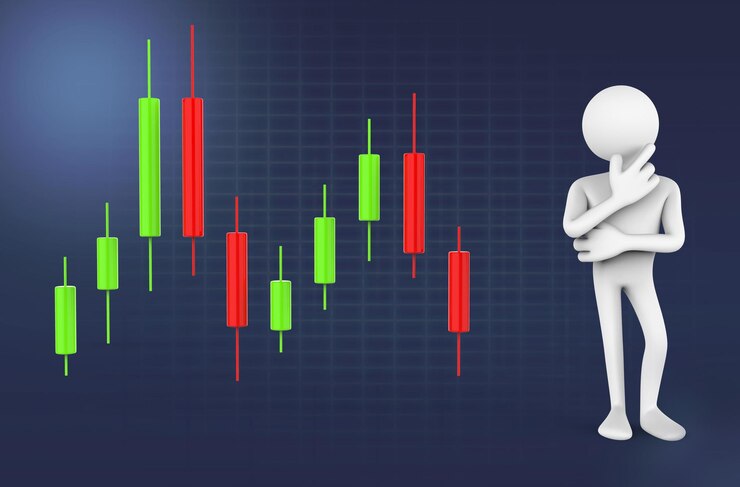
One side dominates the other, and this should be pretty obvious. The chart is filled with green trend bars with a medium-sized body in a strong uptrend, but they closed at a high. The bars are slowly moving upward, which may create a parabolic curve. Any pullback red bar is short-lived, with a narrow body and long wicks at the bottom.
Trade Forex when there is a strong uptrend
At a glance, there are more green bars than red bars. When there is a strong uptrend, it is tough to make money from selling.
But for buyers, you should see profit shortly after entry. The price is pushed up, and no one takes earnings until it reaches a reasonably strong supply zone. Any trend reversal attempt will fail and become the most reliable setup for trend resumption.
The candle wick is very important in price action trading, showing rejection and strength. It is the hidden truth of domination. In an uptrend, you should see long wicks at the bottom of the bars, not at the top. This means that any selling is rejected and pushed up. The same principles apply to a downtrend—more cascading red bands with a medium-sized body and wicks above the bands.
Any dip in the green bar is considered minor and short-lived.
Here, we had a solid downtrend. There are a few green bars and several bearish bars. The close of each candle is lower than the previous close. It is in a parabolic curve and is not trapped. On a trend day, a market dominated by bulls is often characterized by the following bar patterns: First, we have more bullish bars than bearish bars.
When you see this on our charts, the bulls have more power and are increasingly increasing the market. We will also see successive bullish bars. Consecutive bullish bars are a clear signal of upward momentum. In a bull market, green objects are more significant than red objects.
When you see this on our charts, it is a sign that the bulls have more power than the bears. Also, during a bull-dominated market, we will see the green bars close near their highs. This indicates good upside momentum because the bulls try to keep prices high.
We will also see many wicks below the green bars. This is also a good sign that the bulls are controlling the market and trying to push prices higher. When we see green objects getting bigger, this indicates clear upward momentum.
Old School High and Low Low in Forex
First, the follow-up bars must break the previous bars. For example, each follow-through green bar in an uptrend should have a higher low, higher high, and high near the last bar. And vice versa for a downtrend, red bearish bars should make a lower low, higher high, and close lower than the previous bar.
Another explanation is based on the structural pattern: the pivot point of each swing. The price never moves in a straight line; it moves in waves. Each wave will create a pivot point on the chart.
Watch the price movement of Forex currencies closely.
You will notice that the Forex currency catches the bars somehow and pushes them in the breakout direction. For a bullish breakout, the price will stop around the middle of the range around the EMA. The opposite is valid for a downtrend. The price will test Forex currencies and be pushed to the downside.
Now, your task is to open your trading platform, choose one market, and start analyzing price action using these techniques and only these techniques. I could mention chart patterns like flags or triangles, but those are just ranges. I could mention dozens of candlestick patterns, such as inside bars or piercing lines, but these are unimportant. Decoding the market rhythm, distinguishing between a trend day and a range day, and reading the price momentum are essential.
Summary
These pivot points can often be found on pullbacks in a trend. They are important turning points that represent areas of demand/supply. The best way to use these pivot points to identify a trend is to create a trend line by connecting them with straight lines. You do not need advanced knowledge to draw complex trend lines.
